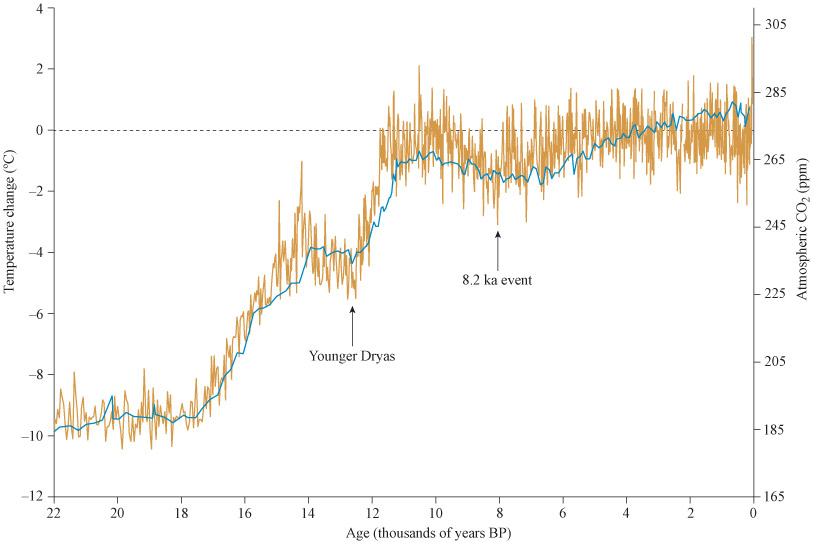
Figure 19 The global atmospheric CO2 concentration (relatively smooth line) and Antarctic air temperature change (spiky line) from the EPICA ice core over the last 20 000 years up to 1813 (CO2) and 1911 (temperature)

Personalise your OpenLearn profile, save your favourite content and get recognition for your learning

Start this free course now. Just create an account and sign in. Enrol and complete the course for a free statement of participation or digital badge if available.