
T1- and T2-weighted images
You’ve seen that the intensities of the tissues in an image will depend on their relaxation characteristics, but it’s also important to consider the way in which the MRI sequence is set up.
Contrast can be enhanced by designing the pulse sequence so that either or effects dominate the relative intensities measured for different tissues.
Images are said to be either -weighted – that is, the image contrast depends largely on the differing values of the tissues – or -weighted. In fact, you saw this being put into practice with a real patient in Video 3.
For example, in -weighted images, the MRI sequence is set up so that it is repeated at set time intervals. This is referred to as the repetition time (TR). This means that signals from voxels which contain tissue with large values, compared with TR, will be saturated to some extent. Essentially, there will have been insufficient time for the thermal equilibrium population of the magnetic energy levels to be re-established before the imaging sequence is applied again. Such tissues will appear very dark and those with small values very bright.
It is important to recognise that the value of TR is set by the operator of the MRI instrument and so it can be set to ensure optimum contrast between specific tissues with different values of .
-
Predict the appearance of a -weighted image of the spine containing CSF and fat-based tissue. (Hint: look back at the values in Table 1.)
-
A characteristic of a spine (or indeed brain) -weighted image is that CSF (‘large ’) appears very dark and fat-based tissue (‘small ’) appears very bright.
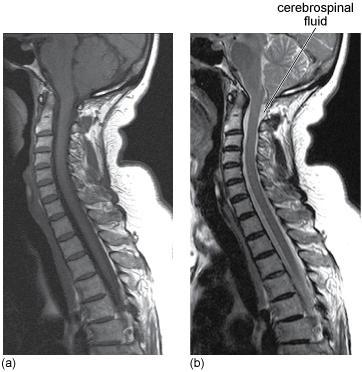
Figure 10 shows a - and a -weighted image of a spine.
-
What differences do you notice in these images?
-
In -weighted images, tissues that have lower values (in particular, fat) appear bright.
In -weighted images, tissues that have greater values such as CSF (and water) appear brighter.
- -weighting is particularly used to image anatomy, for example the boundary between different types of tissue, such as the brain, because white and grey matter have different values of (see Table 1).
- -weighting is more sensitive to water, which appears as bright in Figure 10b. Unfortunately, -weighted images have a poorer signal-to-noise ratio and so are not such clear images. -weighting is used in particular to show disease, as water tends to accumulate in diseased tissue and appears bright against normal tissue.
It can be useful in diagnosis to be able to enhance the contrast even more. This can be done by injecting patients with artificial contrast agents. As you’ll see later, this involves the use of complexes of the element gadolinium.
-
Where is gadolinium located in the Periodic Table?
-
Gadolinium is an element from the f‑block – more specifically, it is a lanthanide.