
Structure Tables (15 minute read)
Learning Outcome:
After completing this lesson, you will understand how a structure table is constructed from the data in a SAM and how it can be used to predict and explain model results.
What is a Structure Table?
A structure table describes the structure of an economy. It uses from the SAM to describe the economy in terms of shares instead of values. Expressing the data in terms of shares is helpful because it puts each part of the economy into perspective relative to the rest of the economy. For example, whereas the SAM reports that the U.S. produces $326 billion worth of agricultural products, the U.S. structure table puts this into perspective by showing that the share of agriculture in U.S. GDP is just 1% (Table 1). Knowing the role of agriculture in the economy can help you to predict and interpret results. You might expect, for example, that a technological transformation in farm production practices will have a large effect on agricultural output and employment, but little effect on the rest of the economy.
You can refer to the US333 structure table in many of the hands-on exercises in this course, as you build your skills in interpreting model results.Table 1. Structure of the U.S. Economy Using the US333 Database
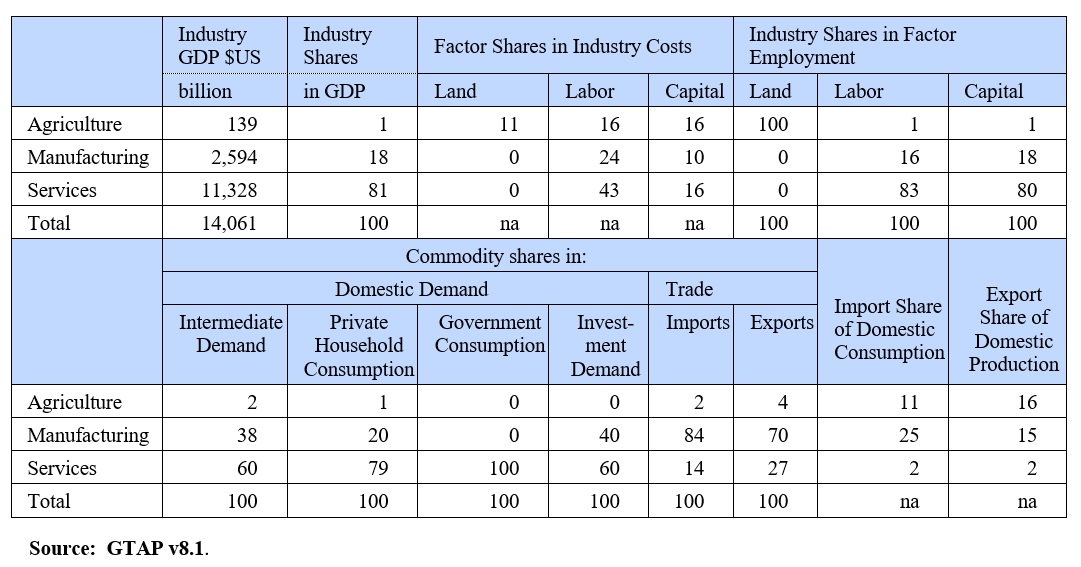
View a large type version of the US333 structure table HERE.
How to Use a Structure Table
These are some examples of how the structure table can be used to develop insights about your experiment results:What if a change in consumer tastes causes the demand for services to increase?
- Services accounts for 83% of labor employment in the U.S. Even a small percentage increase in its output and employment could create strains on the supply of workers available to AGR and MFG, causing those industries' output to fall.
- Producers and investors spend proportionately more on MFG goods than than households so they will feel the pinch more than household consumers.
- Manufacturing accounts for a larger share of imports than agriculture or services. Raising the import tariff on manufactures is therefore likely to generate the most tariff revenue, unless consumers will readily switch from imports to the domestic variety.
- Given the small share of agriculture in GDP, consumption and trade, the economy-wide impact is likely to be small.
How To Build a Structure Table
How can you create a structure table? The UNI-CGE model will generate structural data for you. And, you can view country structure tables in the Structure Table Library in the UNI-CGE module of this course. It can be useful to understand the formulas used to create each type of the structural data. These formulas are presented in Table 2. The structure table files in the Library provide a visual demonstration of how these indicators are calculated from data in the SAM.
Table 2. How to Build a Structure Table

View a large type version of the table
()
.

Copyright Cornerstone CGE CC 4.0 BY-NC-SA