
Macro Balances and Macro Constraints (25 minute read)
Learning Objective:
After completing this lesson, you will be able to identify the macro balances in the SAM and the equations in the UNI-CGE model that ensure macroeconomic equilibrium in savings and investment, the government budget and the balance of trade.
A Balanced SAM - Both Micro and Macro
 From our study of the SAM, you know that it reports all of the transactions in an economy at a point in time. It reports micro data, such as the commodities that are produced, exported and imported, and where factors of production are employed. Macro data are either reported in the SAM or they can be calculated as aggregations of the micro data in the SAM.
The SAM is balanced when income is equal to expenditure - this includes balances in its macro aggregates. For example, GDP expenditure must equal GDP income, and aggregate savings must equal total investment spending.
Macro Equilibrium in the CGE Model
How does a CGE model ensure that macro aggregates remain in balance after an experiment is run? CGE models include equations called macro constraints that impose macro balances. In this lesson, we explore the three macro balances in the UNI-CGE model and the model equations that constrain them. These are the:
1. Savings-investment balance
2. Government budget balance
3. Current account (trade) balance
The Savings-Investment Balance in the SAM - Sources of Savings
In a CGE model, investment spending in an economy is equal to the amount of available savings both before and after a model experiment. We start our discussion of the S-I balance by looking at the savings and investment balance in the US333 macro SAM (Table 1).
Table 1: Savings-Investment Balance in the US333 Macro SAM ($bill)

Larger version available HERE.
There are three sources of savings in the SAM. The first two are domestic sources, and the third is foreign savings:
- Households savings is the after-tax income that is not spent on consumption:
Household income - taxes - consumption = Household savings
$11,788 - $20 - $9,949 = $1,819 billion
- Government savings is the government's budget balance. When a government runs a fiscal surplus, it adds to domestic savings (a positive savings value). When the government runs a fiscal deficit, it is dissaving, or borrowing (a negative savings value):
Government revenue - government spending = government savings
$2,294 - $2,258 = $35 billion
- Foreign savings is the capital account balance, which is the flip side of the current account balance, or trade balance. When a country runs a trade deficit, it represents an inflow of foreign capital. This inflow enables a country to consume more than it produces, and import more than it exports. When a country runs a trade surplus, it is an outflow of its savings to other countries. In the US333 SAM, the US runs a trade deficit and has a foreign savings inflow.
Exports - Imports = Foreign Savings
$2,226 - $1,394 = $831 billion
The total supply of savings in the US (domestic plus foreign) is $2,686 billion.
The Savings-Investment Balance in the SAM - Investment Spending
Investment spending is the cost of commodities purchased by investors. These commodities are the capital equipment that will be used in production processes. Recall our study of gross versus net investment. Some of these purchases will just replace worn out, depreciated equipment, and some commodities will be new additions to the capital stock. Gross investment is total investment spending and net investment is gross investment minus spending that replaces depreciated equipment.
In the US333 SAM, gross investment spending totals:
$2,686 billion
The total supply of savings is equal to gross investment spending, so this S-I macro relationship is balanced (with rounding) in our model's base data:
Household savings + government savings + foreign savings = Investment spending
$1,819 + $35 + 831 = $2,686
Savings-Investment Constraint in the UNI-CGE Model
In the UNI-CGE model, the savings-investment equilibrium constraint is imposed by the equation presented in Figure 1. Total savings is the sum of household savings, government savings (GSAV) and foreign savings (FSAV). Foreign savings is converted into the domestic currency as the product of FSAV and the exchange rate (EXR).
Household savings is the product of the savings rate (marginal propensity to save is MPS), the household income tax rate (TY) and household income (YH). Using data in the US333 SAM, the US MPS is calculated as 15 percent of after-tax income ($1,819 / ($11,788 - $20)). Household variables are defined over the set h, which is the set of household types, such as rural and urban. The US333 SAM has only one type of household, but In a database with multiple households, variables MPS, TY and YH can differ across types.
Figure 1. Savings-Investment Constraint in the UNI-CGE Model

Larger version of figure available HERE.
Government Budget Constraint
Governments do not necessarily have to balance their budgets, with spending equal to their tax revenues. Governments can borrow money if their spending exceeds tax revenue. Conversely, they can run budget surpluses that add to the supply of national savings if they spend less than government income. Total government spending equals its tax revenue plus or minus its borrowing or savings.
In the US333 macro SAM (Table 2), the US government receives tax revenues that sum to:
$2,294 billion
The US government spends the revenue on purchases of commodities:$2,258 billion
US government spending is lower than its revenues. It runs a budget surplus that adds to the supply of savings that is available to investors. The US government budget balance (with rounding) is:$2,294 - $2,258 = $35
Table 2: Government Budget Balance in the US333 Macro SAM

Larger version available HERE.
In the UNI-CGE model, an equation (Figure 2) constrains the government's income (YG) to be equal to its expenditure (EG) plus borrowing or savings (GSAV) that occurs - that is, its budget deficit or surplus - when government tax revenue does not equal its expenditure.
Figure 2: Government budget constraint in the UNI-CGE Model

Larger version available HERE.
Current Account (Trade) Balance Constraint
An economy's current account balance, or trade balance, is the difference between its exports and imports, valued in world prices (CIF import values and FOB export values). In the US333 macro SAM (Table 3), US exports to the world are:
$1,394 billion
US imports from the world are:$2,226 billion
The US runs a trade deficit (exports minus imports) of:$1,394 - $2,226 = -$831 billion
Notice that the trade deficit is reported in the SAM as a positive number. That is because the SAM reports the capital account balance, which is the flip side of a trade balance. When the US consumes more than it produces, it must rely on foreign capital inflows to support a level of spending that exceeds its income. A trade deficit therefore adds to the supply of loanable funds because it represents an inflow of foreign savings. This may look beneficial, but it is important to note that these borrowed funds must be paid back at some time in the future.
Table 3: Current Account (Trade) Balance in the US333 Macro SAM

View larger version HERE.
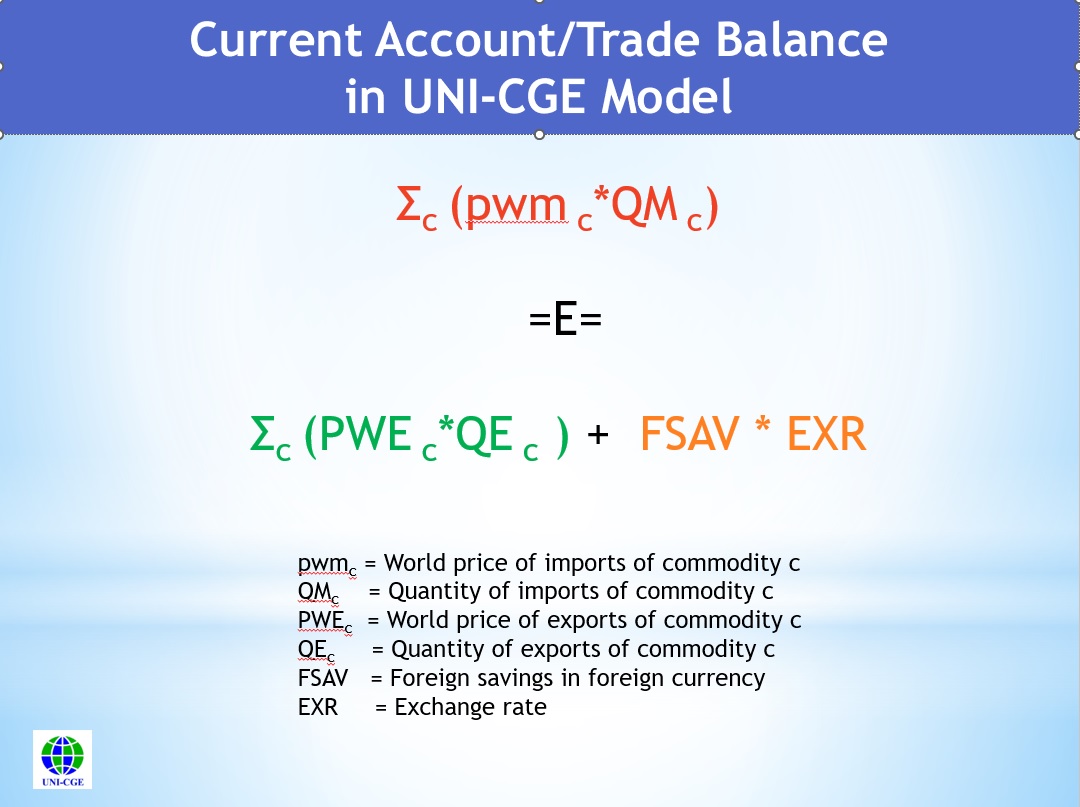
In the UNI-CGE model, the current account balance equation imposes the constraint that the value of imports is equal to the value of exports plus foreign savings (Figure 3). The equation allows a country to incur a surplus or deficit when the value of its imports is not equal to the value of its exports.
Figure 3: Current account balance constraint in the UNI-CGE Model
Larger version HERE.
CHECK YOUR UNDERSTANDING
Copyright Cornerstone CGE CC 4.0 BY-NC-SA