
Macro SAMs, Macro Indicators and the Circular Flow (25 minute read)
Learning outcome:
At the end of this lesson, you will be able to interpret the data in the macro SAM as a circular flow, and calculate macroeconomic indicators.| What macro SAMs do: |
|---|
| - Display summary measures of an economy, such as total imports |
| - Can be used to calculate macro economic indicators, such as GDP |
| - Describe the circular flow of income and spending in the macro economy |
Macro Aggregates in a SAM
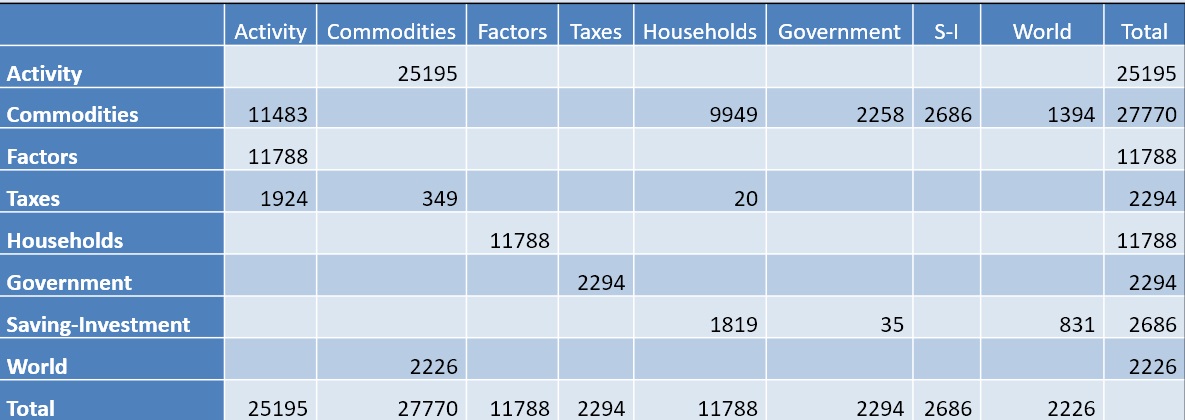
The US333 Social Accounting Matrix that we are studying in this course contains microeconomic data. In the Data module, you learned how to aggregate the micro data in the SAM to create a macro SAM for the US, shown in Table 1.
Table 1. US333 Macro SAM
Larger version available HERE.
Macro SAM and Macro Indicators
A macro SAM is useful is because it displays summary data for an economy. The data enable you to quickly answer questions such: What is the total value of US imports? (Answer: $2.2 trillion.) What is total US household income? (Answer: $11.8 trillion.) And, how much does the US government spend on goods and services? (Answer: $2.3 trillion.).
These summary data also enable you to easily construct macro indicators such as GDP. Table 2 presents the macro SAM with color coded cell entries, to demonstrate how to construct selected macro indicators.
(1) National Income Accounts Identity Equation (GDP expenditure):
Y = C + I + G + (E-M)
Shown in green $14,061 = $9,949 + $2,686 + $2,258 + ($1,394 - $2,226)
(2) GDP Income:
Y = Factor Payments + Taxes (indirect)
Shown in yellow $14,061 = $11,788 + $1,924 + $349
(3) Savings-investment Balance
Rearranging the national income accounts identity equation, the net capital inflow is equal to the trade balance. A negative is a trade deficit, a positive is a trade surplus. (** A trade deficit is reported as a positive number in the SAM because it is a positive capital inflow to savings)
Domestic Savings - Investment = Exports - Imports
S - I = E – M
Shown in blue ($1,819 + $35) - $2686 = $1,394 - $2,226 = -$831
(4) Balance of Trade
Balance of trade = Exports - Imports
Shown in blue -$831 = $1,394 - $2,226
(5) Government Budget Balance
Government revenue minus government expenditure
Shown in red $35 = $2,294 - $2,258
Table 2. Constructing Macro Indicators with the Macro SAM

Larger version available HERE.
Circular Flow in the Macro SAM
A macro SAM is a useful visual aid in illustrating the circular flow of income and expenditure in the macro economy. Similar to the detailed SAM, every cell in the macro SAM that reports an expenditure by one account is simultaneously income to another account. In table 3, we can trace this circular flow in seven steps:1. Production activities pay wages and rents to the factors used in their production process.
2. Factor income is paid to households.
3. All taxes in the economy are paid to the government
4. All savings (domestic and foreign) are sent to investors.
5. Households, government, investors and the rest-of-world use their income to buy commodities.
6. Demand for commodities is met by domestic production and imports.
7. Domestic goods are produced by production activities
Production activities then pay wages and rents to the factors used in their production process, returning to step 1.
Table 3. Tracing the Circular Flow in a Macro SAM in 7 Steps

Larger version available HERE.
CHECK YOUR UNDERSTANDING
Use data in the macro SAM for India to answer the questions below.
| Activity | Commodity | Factors | Household | Gov't. | S_I | World | Total | |
|---|---|---|---|---|---|---|---|---|
| Activity | 3,487 | 3,487 | ||||||
| Commodity | 1,752 | 1,153 | 226 | 595 | 326 | 4,051 | ||
| Factors | 1,731 | 1625 | 1,731 | |||||
| Household1,625 | 1,625 | |||||||
| Gov't. | 4 | 1 | 142 | |||||
| S-I | 106 | 472 | -83 | 100 | 595 | |||
| World | 426 | 426 | ||||||
| Total | 3,487 | 4,051 | 1,731 | 1,625 | 143 | 595 | 426 |
Source: GTAP v11.