
Macro SAMs (20 minute read)
Learning outcome:
At the end of this lesson, you will understand the
relationship between a SAM and a macro SAM, and be able to create a macro SAM and interpret its data.
Micro and Macro Data in a SAM
Microeconomic data describe an economy in detail. The US333 Social Accounting Matrix that we are studying contains microeconomic data. Examples are data on all inputs used by each production activity; the commodity composition of final demand and trade; and taxes paid by activity, commodity and factor.
Macroeconomic data describe aggregate economic activity in the economy as a whole. Macro data report things like the combined payments to all factors by all activities, the aggregated consumption of all commodities by all households, total tax revenue, and total exports and imports. Macroeconomic data are reported in a “macro SAM.”
Creating a Macro SAM
Most of the data in a macro SAM is created by aggregating the microeconomic data in a SAM. We will use the activity accounts in the US333 SAM as an example (Table 1). Its three activity rows and columns (labeled 1, 2 and 3 and shaded in yellow) are aggregated into a single Activity row account and a single Activity column account in the macro SAM (Table 2). The activity column account in the macro SAM now reports total intermediate input demand, total factor demand, and total taxes paid by all activities combined in the US economy. The activity row account in the macro SAM reports the combined sales of activities' output to the commodity account.
Figure 1. US333 SAM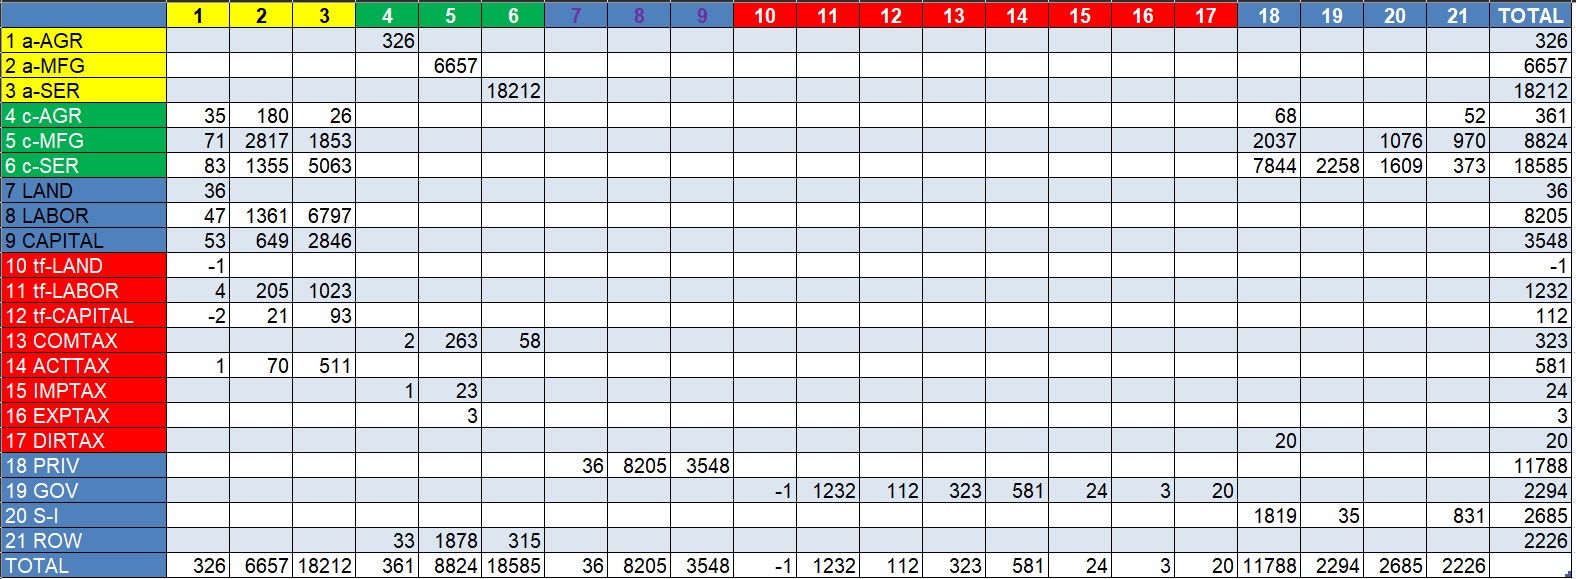
Larger version is available HERE.
The rows and columns for commodities in the micro SAM (labeled 4, 5 and 6, and shaded in green), are similarly aggregated a single commodity row account and a single commodity column account in the macro SAM. The rows and columns for factors of production, the rows and columns for taxes, and each element of final demand in the US333 SAM are also aggregated.
Figure 2. The US333 Macro SAM with descriptions of the aggregated data 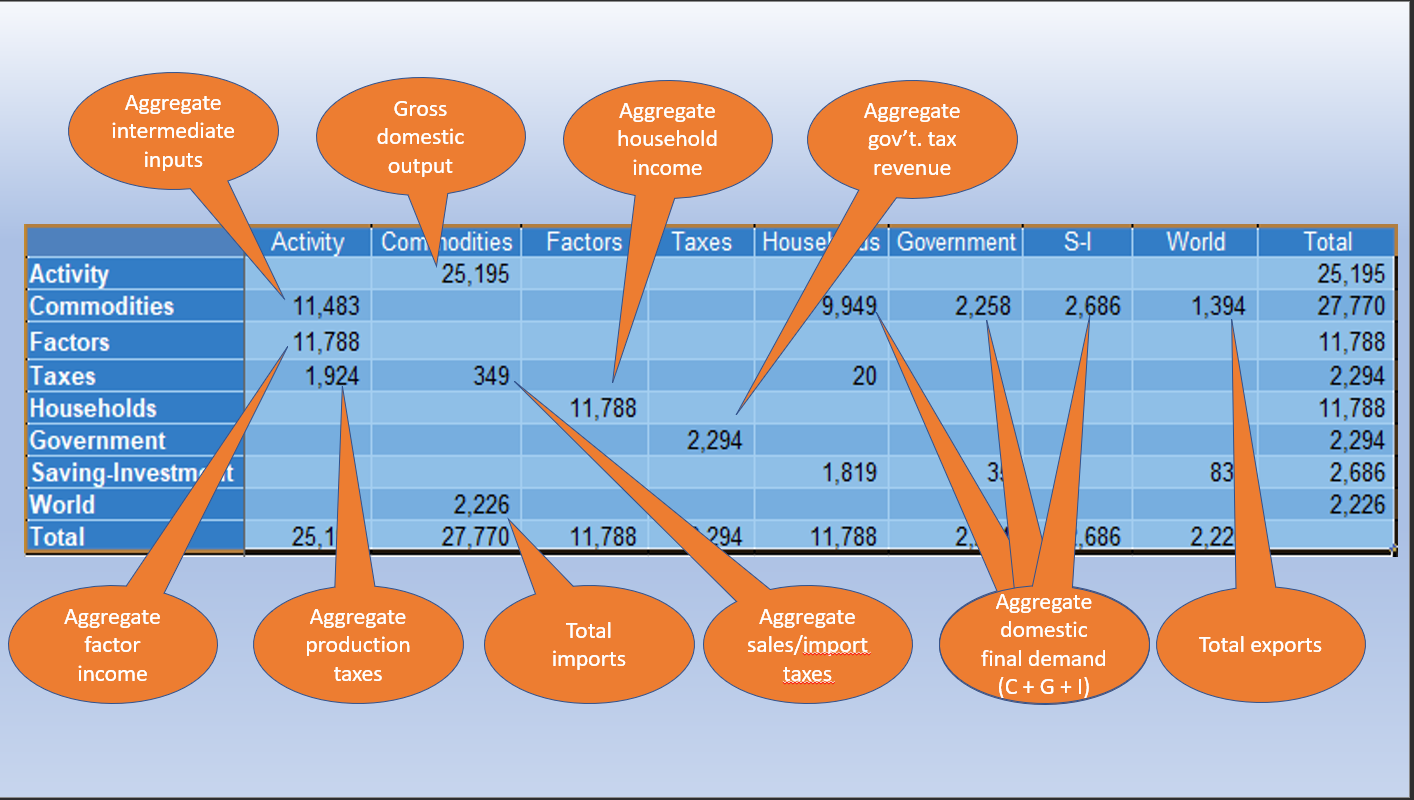
Larger version is available HERE.
The orange bubbles in Table 2 define the key macro data that have been aggregated from micro data. Note that the US333 SAM has a single household type. If the CGE model database has multiple household types, the household columns and rows would be similarly aggregated into one household account.
US333 Macro SAM
The US333 Macro SAM is presented in Table 3. Regardless of the number of activities, commodities, factors, taxes or households are in a CGE model database, the structure of a macro SAM will be the same because these micro data are aggregated into macro data.
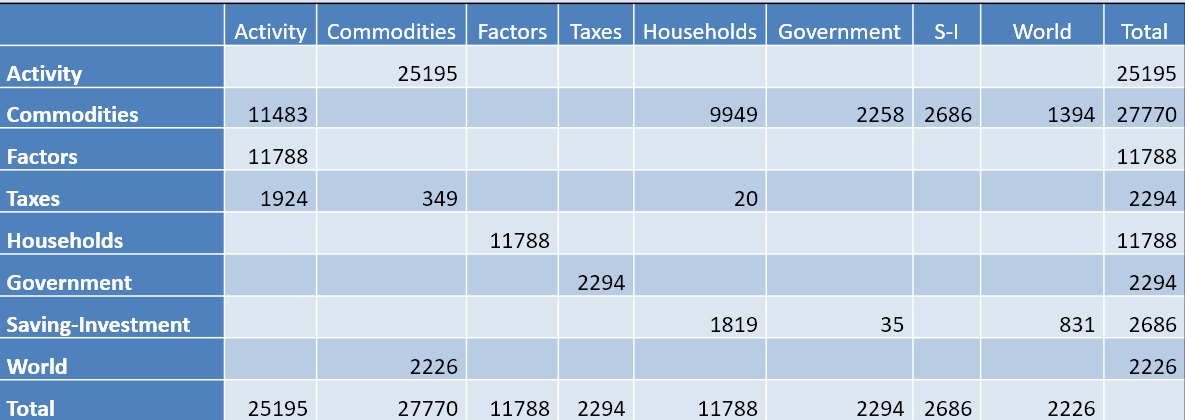
Larger version available HERE.
CHECK YOUR UNDERSTANDING
Use the Macro SAM for India to complete the exercise.
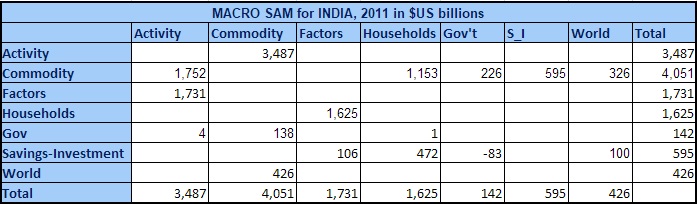
Larger version available HERE.
Copyright: Cornerstone CGE CC 4.0 BY-NC-SA