
7 Using the digital fluorescence microscope
Finally, it’s time for you to leave the theory behind and explore real samples using the digital fluorescence microscope (DFM). Start by watching Video 3 which introduces the DFM and how to use it. Please note that the microscope shown in the video contains a different set of slides than the one you will be working with. For example the ‘Tutorial slide’ featured in the video is labelled ‘Training slide A’ in your version of the DFM. Despite the difference in slide sets, both DFMs operate in the same way, and the instructions provided in the video are fully applicable to your microscope experience. Each slide includes some text explaining the type of staining used and highlighting the key features you should focus on when exploring the slides. For convenience, you might want to open the DFM in a separate tab so you can refer to the course questions while examining the slides.

Transcript: Video 3 An introduction to the digital fluorescence microscope. (This video mentions other resources from the full OU course – these can be ignored.)
Now go to the DFM [Tip: hold Ctrl and click a link to open it in a new tab. (Hide tip)] (open the link in a separate tab/window so you can easily return here).
Examine Slide 01: Training slide A – fluorescent dyes. Inspect the staining for nuclei, mitochondria and cytoplasm using the respective channels (Channels 01–03), then look at the merged images (Channels 04–07) to familiarise yourself with the microscope. Note that if the view doesn’t change when clicking on a specific channel, choose a different channel and then try again.
You will be asked to observe colour changes that can indicate a co-localisation of structures (i.e. them being in the same place). People can see colours differently, so you might not see a change to the colour exactly as the course describes. That’s fine – you might have a different perception of colours. As long as you observe a clear colour change, this indicates a co-localisation of the respective structures.
After inspecting all channels, answer the following questions in the text boxes provided.
Question 1
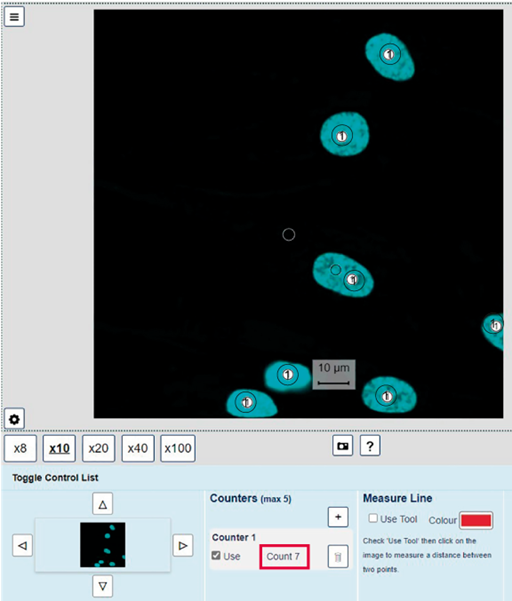
How many nuclei are there on Slide 01: Training slide A – fluorescent dyes? Which channel did you use to count them and why?
Answer
There are seven nuclei (Figure 16). Each cell has a single nucleus, so the nuclear staining in Channel 01 (or in Channels 04, 05 or 06) is a good way to identify the nuclei on the slide.
Question 2
What is the length and width of the nucleus at position X: 3016, Y: 575? For your measurements, assume that the nucleus has an elliptical shape. The length is the longest diameter (distance). The width is measured at approximately a right angle to the length, at the place where the ellipse is the widest. You can see examples of these measurements in the answer. Give your answer to one decimal place. Which channel and objective did you use to make your measurement? You can record your measurement(s) in Table 3 below.
| Lengths (longest lengths) to 1 decimal place (μm) | Widths (smallest lengths) to 1 decimal place (μm) | ||||
|---|---|---|---|---|---|
| Mean = | Mean = | ||||
Answer
Here’s a completed version of the table.
| Lengths (longest lengths) to 1 decimal place (μm) | Widths (smallest lengths) to 1 decimal place (μm) | ||||
|---|---|---|---|---|---|
| 18.7 | 18.3 | 18.9 | 12.4 | 12.5 | 12.8 |
| Mean = | 18.6 | Mean = | 12.6 | ||
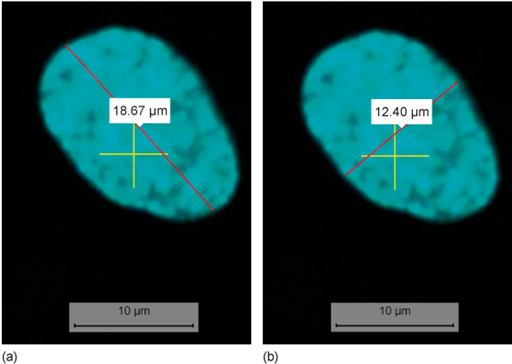
The measurement should be done in Channel 01 because it only shows the nuclei, thus clearly identifying the borders of the nucleus.
The largest objective that shows the whole nucleus should be used to make the most accurate measurement. From our experience, this was the ×40 objective. This may differ depending on your screen size.
Question 3
To develop your skills in making observations in micrographs, inspect Slide 01: Training slide A – fluorescent dyes and take notes about the appearance of the mitochondria and their localisation. Include information about which channels you use to make these observations.
Answer
Mitochondria form a tubular network (Channel 02) that spreads through the cytoplasm (Channels 06 and 07). They are absent from the nucleus (Channel 06 and 07; or flicking between Channels 01 and 02). In a few places, mitochondria can be seen in an area with only weak staining for the cytoplasm (e.g. X: 3731, Y: 2060; Channel 06).
Question 4
Now inspect Slide 02: Training slide B – EGF receptor (cell membrane) and practise determining if two structures co-localise, meaning they are present in the same place in a cell. Co-localisation can be identified by a colour change in the fluorescence micrographs (e.g. co-localisation of a green and a red structure results in a yellow colour; co-localisation of green and purple structures results in white – keep in mind though, that you might perceive any change to be a different colour).
To practise identifying co-localisation, go to the positions listed in the first column of Table 4 and observe the colour at this position in Channel 08. Use this information to state which structures might overlap at this position. Record your observations in Table 4 below. Note that one example answer is provided.
| Position | Colour | Co-localisation | Explanation |
|---|---|---|---|
X: 1963 Y: 714 |
yellow |
microtubules and ER |
The yellow colour indicates overlap of Channel 03 (microtubules) and Channel 04 (ER) |
X: 2124 Y: 2586 |
|||
X: 2095 Y: 2082 |
Answer
Here’s a completed version of the table.
| Position | Colour | Co-localisation | Explanation |
|---|---|---|---|
X: 1963 Y: 714 |
yellow |
microtubules and ER |
The yellow colour indicates overlap of Channel 03 (microtubules) and Channel 04 (ER). |
X: 2124 Y: 2586 |
red |
none |
The ER does not co-localise with structures nearby, e.g. the cell membrane (purple) or microtubules (green). |
X: 2095 Y: 2082 |
white |
cell membrane and microtubules |
The white colour indicates co-localisation of Channel 01 (cell membrane) and Channel 03 (microtubules). |
Question 5
In Slide 06: Endoplasmic reticulum (ER), compare the distribution of the ER in the cells at positions X: 1400, Y: 2700 and at X: 3800, Y: 1600. Considering what you’ve learned so far and comparing to what you’ve seen in the other slides in the DFM, which appearance is typical for the ER?
Hint: use Channels 01 and 05 to answer the question.
Answer
The ER forms a network distributed throughout large parts of the cytoplasm in the cell at X: 1400, Y: 2700. In contrast, the ER is only present around the nucleus in the cell at X: 3800, Y: 1600. A distribution throughout the cytoplasm is more typical for the ER.
Channel 01 clearly shows the ER surrounding the nucleus in the cell at X: 3800, Y: 1600, better than the merged view in Channel 05. The ER network can be seen in Channel 05.
Question 6
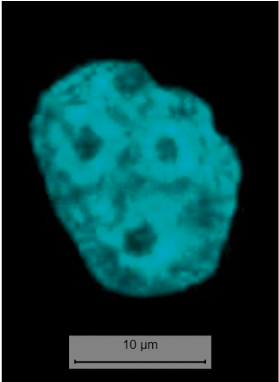
This is more of a fun, light-hearted question. In Slide 07: Golgi apparatus, which nucleus resembles an emoji of a face with an open mouth: 😮?
Hint: use Channel 02 to answer this question.
Question 7
Compare the ER staining in Slide 07: Golgi apparatus to that you have seen in previous slides. What is unusual?
Hint: use Channels 04 and 08 to answer the question.
Answer
In Slide 07, the ER is located in the centre of the cell (Channel 04). It does not appear as a network in the cytoplasm, which is the typical distribution of the ER. The staining here is probably an artefact, caused by, for example, a problem with the fixation of the cells or the antibody staining.
Question 8
Using the ×40 or ×100 objective, go to X: 2630, Y: 1700 in Slide 08: Early endosomes and explain why the structure at this position is white.
Hint: use Channels 01–04 and Channel 08 to answer the question.
Answer
At the position of X: 2630, Y: 1700, early endosomes (Channel 01, purple) and microtubules (Channel 03, green) co-localise (i.e. are present at the same place). The merging of these two colours results in the structure being white (instead of green or purple) in Channel 08. (Remember that a co-localisation of green and red staining would be visible as yellow, and that you might observe the changed colour differently, i.e. not white or yellow.)