

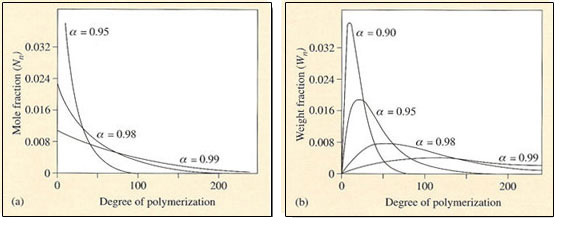
Figure 41 Molecular mass distributions in step growth polymerization. The number distribution (a) is shown for three different extents of reaction, α. The mass distribution (b) shows a single narrow peak which progressively broadens and shifts to high molecular mass as α approaches unity