

5.3.1 Time-temperature superposition
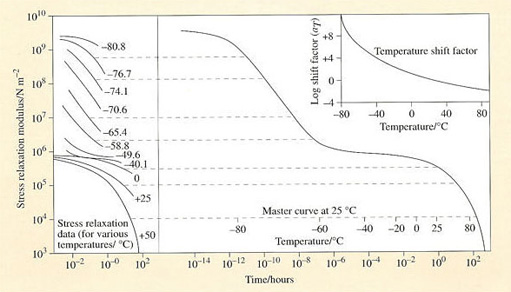
For amorphous polymers above their Tgs, there is a convenient approximation which makes experiments easier. It is known as time-temperature superposition, and it relates time to temperature for viscoelastic materials. A sequence of measurements of ER (t) is performed at different temperatures at a fixed initial strain. The time scale might be limited between several seconds and say 100 hours. The curves obtained on uncrosslinked polyisobutylene (PIB) are shown in the lefthand portion of Figure 47, with temperatures of measurement varying from −80.8 °C up to +50 °C. The curves span many decades of modulus, reflecting the change in behaviour of the material. At the lowest temperatures PIB is becoming glass-like, so ER (t) is very high. As the material passes through the transition region, the modulus drops rapidly – the material is becoming rubbery in its response to the applied stress. The onset of true elastomeric behaviour is marked by the so-called rubbery plateau. This is followed by another steep fall in modulus where viscous flow occurs as the temperature is raised further.
Box 11 Why creep and stress relaxation are often needed
It is usually said of engineering polymers that they are ‘difficult’ and ‘problematic’ materials for designers to use in stressed applications. Such comments often come from engineers who have been brought up with mild steel as the material of choice for any application, since design calculations are normally much more straightforward when the extra variable of time can be neglected (not that you can neglect time when corrosion is possible!). But a brief consideration of many consumer products shows that creep and stress relaxation are sometimes necessary for the correct functioning of many products and devices.
Consider leather shoes and boots where the stress relaxes under the constant strain of the foot, or clothes which relax from the strain applied by the human body. Rigid and inflexible materials would be quite inappropriate for protecting the human body comfortably. There are other examples too, from civil engineering, where viscoelastic timbers in a bridge or building creep and relax to accommodate imposed stresses and strains. In old buildings, such shape changes are regarded as of positive value in assessing its age and integrity.
Mastic polymer is used to seal joints in buildings where some movement is likely: its function depends on being able to flow and ‘give’ when strained, so maintaining a good seal.
Nevertheless, in many applications, creep and relaxation must be faced and appreciated; too much distortion may cause the part to drop away and so the product ceases to function. Loss of sealing stress in rubber joints can cause leakage of oil from engines, and hence failure. It is only by careful design in matching product function and material that such problems can be solved.
The curves can be fitted together like a jigsaw puzzle, as shown in the right-hand portion of Figure 47 to form a ‘master’ curve, a single curve which represents the stress relaxation behaviour of PIB at a reference temperature of 25°C. The two scales, time, t, and temperature, T, are shown for the master curve. The derived relation between time and temperature aT is plotted in the upper right-hand inset of the figure and can be modelled by the Williams-Landel-Ferry (WLF) equation
when the reference temperature for the shift is chosen to be Tg and the numerical factors are the fitting parameters for this grade of PIB.
The master curve of Figure 47 indicates how PIB responds to stress at much shorter times than are accessible directly by this type of experiment and also re-emphasises the common polymeric behaviour of both rubbers and thermoplastics. They differ only in their glass transition temperatures: an amorphous thermoplastic is rigid at ambient temperature because its Tg lies above ambient temperature, and conversely a rubber is flexible because its Tg lies below ambient temperature. Any rubber will become rigid or glasslike if the temperature of the environment is low enough, and any thermoplastic will become rubbery at high temperatures.