5.3.2 Effects of structure on viscoelasticity
If a single measurement of ER(t) is taken at an arbitrary but fixed interval of time, say 10 seconds, then it will vary with temperature in a way rather similar to the viscoelastic master curve. Such a curve for atactic polystyrene is shown in Figure 48, where the various zones of behaviour are identified. The effect of lightly crosslinking the material is to eliminate flow of any kind, extending the region of elastomeric behaviour to higher temperatures. Heavier crosslinking will move the rubbery plateau upwards and the same net effect is achieved by crystallisation. Although atactic PS is inherently non-crystallisable, the isotactic form can crystallise and its melting point (Tm) is about 230 °C. The stress relaxation modulus of this polymer drops much less at 7V, from about 5000 MN irr2 to about 100 MN m−2 at 140 °C. At the same temperature, atactic polystyrene is completely rubbery with a modulus of about 0.5 MN m−2. Thereafter, the modulus of the crystalline polymer drops.
Molecular mass also affects the stress relaxation spectrum, particularly at intermediate and higher temperatures (>100°C). For high molecular masses, only the rubbery plateau and viscous flow regions differ markedly; the glassy and transition regions are unaffected. Increasing molecular mass clearly improves some mechanical properties, but nowhere near as effectively as crystallisation.
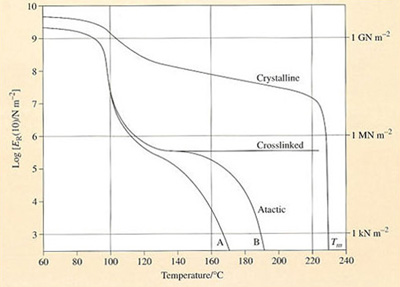
In Figure 48 the main lower curve (B) is that for atactic PS of ![]() = 217 000 and the lower subsidiary curve (A) for a
= 217 000 and the lower subsidiary curve (A) for a ![]() = 140 000. Crosslinking eliminates the rubber and viscous flow regions
= 140 000. Crosslinking eliminates the rubber and viscous flow regions
Self assessment question 9
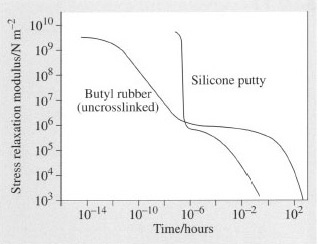
Uncrosslinked silicone rubber treated with boron oxide exhibits curious mechanical properties. If hit hard with a hammer, it shatters like glass, but if dropped from a height of 1 metre it bounces like a rubber ball. When kneaded in the hand it behaves like putty but when left on a flat surface it flows like a liquid.
Sketch the viscoelastic master curve for the material. Assume that the hammer is travelling at a maximum velocity of 20 m s−1 and that the acceleration due to gravity g is 9.8 m s−2. At what velocity would a well-vulcanized NR ball cease to bounce? Assume that both NR and silicone balls are 2 cm in diameter, and that the terminal velocity v of an object dropped from rest over a distance s is ![]() .
.
Answer
(a) The viscoelastic master curve can be sketched from a knowledge of the approximate modulus and time scale for each of the different states. Since all amorphous polymers including silicone show similar moduli for the glassy and elastomeric states, these values can be taken directly from Figures 47 and 48. It remains to estimate the time scales involved for each state.
(i) When hit with a hammer travelling at 20 m s−1, a 2 cm diameter ball will respond in a time scale of about
(ii) When dropped, the velocity can be calculated from simple dynamics:
The time scale of the experiment is thus
(iii) When kneaded, the time scale is of the order of 10−2−100 s.
(iv) When allowed to flow, t = 10−102 s. The resultant master curve is shown in comparison with that of PIB in Figure 49.
(b) For a well-vulcanized NR ball, Figure 51 can be used to estimate the point at which it ceases to bounce – at the maximum of the tan δ versus ω curve. Interpolating from the figure, the maximum damping occurs at ω ≈ 102 Hz, so t = 1/ω = 10−2 s. Using the same arguments as above,
then