1 Using a narrative to help learning
Research shows that asking students to develop a story or narrative as part of their learning activities can help their understanding. Bruner (1986) argues that this is the case because ‘human beings are essentially narrative animals, telling stories to themselves and others as a way of making sense of the world’ (Mason and Johnson-Wilder, 2004, p. 68). This unit will help students to develop such storytelling in the context of making sense of graphs. The underlying theme across all the activities is the notion that ‘every graph tells a story’.
Activity 1 focuses on finding out what makes interpreting graphs so hard. In previous years, you may have told your students the factors that are important to include in a graph. Here, the students themselves work together to generate ideas about this.
Before attempting to use the activities in this unit with your students, it would be a good idea to complete all (or at least part) of the activities yourself. It would be even better if you could try them out with a colleague, as that will help you when you reflect on the experience. Trying the activities yourself will mean that you get insights into learners’ experiences that can in turn influence your teaching and your experiences as a teacher. When you are ready, use the activities with your students. After the lesson, think about the way that the activity went and the learning that happened. This will help you to develop a more learner-focused teaching environment.
Activity 1: Finding out what the problem is with graphs
Preparation
This activity works well if done in groups of four students, because more examples are then available for them to examine. Ask your students to collect and bring to school examples of graphs that they have seen from different contexts: newspapers, adverts, brochures, etc.
The activity
Explain to your students what they are required to do in this activity using the following prompts:
- You were asked to bring in examples of graphs that you have seen. Put these on a pile within your group.
- Sort quickly through the graphs and decide which ones you think you understand without much examination (putting these in an ‘easier’ pile) and which ones you think you will need to examine very carefully to understand (which go in a ‘harder’ pile).
- Examine the harder pile and discuss in your group what it is about these graphs that makes them more difficult. Write down your thoughts about this.
- Now examine the easier pile and discuss in your group what it is about these graphs that makes them easier. Write down your thoughts about this.
- Compare the two lists. What is the same and what is different about these two lists?
- Now use your answers to steps 3 and 4 above to write a list of ‘good things to do when constructing graphs’.
As a class, develop a list of ‘good things to do when constructing graphs’ from the groups’ ideas. Pin this up on the wall so that students can refer to it during later graph work.
Case Study 1: Mr Chadha reflects on using Activity 1
This is the account of a teacher who tried Activity 1 with his secondary students.
This activity did not get off to a good start. I had asked students to bring in examples of graphs and they managed to bring in … none. Perhaps it was lack of motivation, or perhaps it was that they did not know where to find any graphs. To motivate them I asked them to think of examples where graphs are used in real life or in the workplace, and where there could be problems if the graphs are not interpreted correctly.
To give them an example, I showed them the magazine and newspaper that I had brought in with some examples of graphs. By the next lesson most students had brought in several examples. Some even managed to download some graphs from the internet.
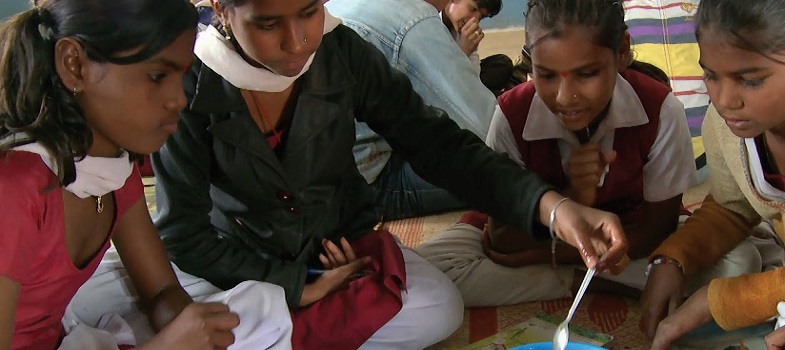
The students worked in groups of four. They found the graphs related to games and advertisements easy and decided this was because the information it represented was simple. They did notice, however, that some of these ‘easy’ graphs used scales that were not clear, and the labels in the axes were also not always correct. They had more problems with graphs representing medical and economic information: they found it hard identifying the variables and interpreting the relations between the variables.
I collected the graphs to use for later activities and told the students to bring in more so we could have a whole library of graphs to use for years to come.
Reflecting on your teaching practice
When you do such an activity with your class afterwards, reflect on what went well and what went less well. Consider the questions that led to the students being interested and being able to get on and those where you needed to clarify. Such reflection always helps with finding a ‘script’ that helps you engage the students to find mathematics interesting and enjoyable. If they do not understand and cannot do something, they are less likely to become involved. Use this reflective exercise every time you undertake the activities, noting, as Mr Chadha did, some quite small things that made a difference.
Pause for thought Good questions to trigger such reflection are:
|
What you can learn in this unit
