3 Building the story of what happens between variables
The previous activity asked students to identify the variables, or characters, in the ‘story’ that a graph represents. Now it is time to find out what happens between these ‘characters’. In mathematical terms, this means examining the graph for how the variables relate to each other at different points and whether that relationship changes.
Students often find it difficult to interpret what a gradient signifies, especially in distance/time graphs. Activity 3 asks the students to think about this through a card sort. Activity 4 then asks the students to use their knowledge about reading and interpreting graphs by making up a story as reporters for the Big Rickshaw Race.
Activity 3: Thinking about gradients and distance/time graphs
Preparation
Prepare enough copies of the card sort in Resource 2.
This activity works well in pairs or in threes. It is less effective for bigger groups, because the students will not all be able to see and read what is on the cards easily.
Remember to tell the class that ‘every graph tells a story’.
The activity
Explain to your students what they are required to do in this activity, using the following prompts:
- Prepare enough copies of the card sort in Resource 2.
- Match the card to its descriptors.
- What do you think the gradients in the graphs are telling you?
- Can you make up some more examples?
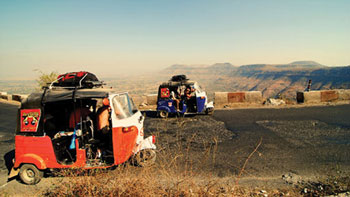
Activity 4: The Big Auto Rickshaw Race
Explain to your students what they are required to do in this activity, using the prompts below.
Figure 2 is a graph that represents the motion of two of the auto rickshaws racing each other as they approach and go around a bend in the road in the annual Big Auto Rickshaw Race.
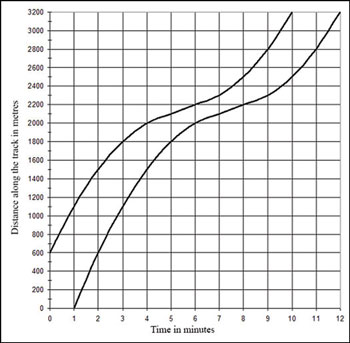
Try to visualise what is going on and answer the following questions:
- How far along the road is the bend?
- Do the two auto rickshaws travel the same distance?
- Do they travel at the same speed?
- On this graph, the auto rickshaws do not start together from the same point. What do you think is happening?
- The auto rickshaw that is ahead seems to lose some of its lead when it approaches the bend, and then opens up a gap again afterwards. Why is this? Is the chasing auto rickshaw really catching up?
- Imagine you are a Big Auto Rickshaw Race reporter, commentating live on the radio. What would you say?
Case Study 3: Mrs Meganathan reflects on using Activities 3 and 4
I thought that using Activity 3 would be too easy for the students. However, while we were using it, both I and the students became aware of the many misconceptions they had. I asked them to work on the card sort in pairs at first. We then had whole-class discussions that I orchestrated by holding up a graph card and asking what the story was, or holding up a descriptor card and asking what the matching graph was. I insisted on the students giving their justifications for what they said. After each justification, I asked the class who agreed, who disagreed and who was not too sure about the justification. This is how the misconceptions got aired and worked on. The task did take longer than I had anticipated but it was very worthwhile.
Activity 3 gave the students the knowledge and confidence to tackle Activity 4. The graph seemed simple at first, but the questions drew attention to some unusual elements – the students expressed surprise when they noticed them. The part where they had to be a reporter was funny. At first they were rather shy about engaging with it, so I invited Shamira, who I know loves acting, to come and sit at my desk and pretend to be the reporter. She had a go and I then asked others to comment constructively on what she had said, including on the interpretation of the graph. Shamira adjusted her story and had another go at it. After that the students were happy to try it out for themselves. Some did it in pairs, some in threes or fours. What I liked was that, while they were ‘reporting’, they were looking at the graph and interpreting the information that was there.
There was an addition to this activity that I loved. During break time I saw two students ‘racing’ against each other and another student pretending to be reporting on the race, including mimicking holding a microphone.
Pause for thought
|
2 Reading and interpreting graphs