2 Data and information
A school self-review is most effective when it is integrated into existing systems and carried out as part of an ongoing process rather than as a separate activity. It may take time to set all this up in your school. As a starting point, you need to start to gather evidence or data on a regular basis (Stage 1 in Figure 2). Data can generally be separated into two types:
- quantitative – numerical data
- qualitative – data collected through techniques such as attitudinal questionnaires, observations and stakeholder interviews.
Quantitative data is generally easier to deal with, since it is indisputable. For example, the following are statements of fact:
- the percentage of students who gained above 80 per cent in Class X examinations
- the attendance level of female students in the year
- the number of staff meetings that were held
- the proportion of parents who attended a meeting.
Qualitative data is quite different in nature, and is more about opinion:
- feedback on new textbooks
- opinions about how best to teach multigrade classes
- what makes students feel safe at school.
For comprehensive school self-evaluation there is likely to be a mix of quantitative and qualitative data gathered, but it is only when this is analysed to identify patterns or draw conclusions that this data becomes useful information.
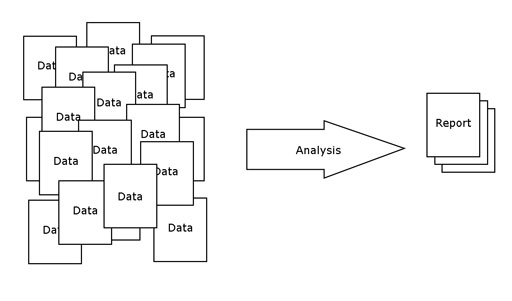
Figure 3 Data needs to be analysed to be useful.
Activity 4: Sources of evidence
A school self-review should start by thinking about the sorts of questions you wish to ask, what data you have, and what data you will need to collect.
Work with your deputy and other senior colleagues (or if you are the leader of a small school with less than five teachers, involve everyone) to complete the school data matrix in Resource 1.
- For each question, identify a possible source of data and how it could be collected.
- Think about how you could analyse that data to find out as much as possible about your school. (For example, attendance and achievement data can be analysed to see how male and female students perform.)
- Add some more questions that you would like to investigate in your school.
Discussion
It is likely that you will have more quantitative than qualitative data to start with. This is likely to cover examination results, attendance, health and safety meetings, and so on. You may have little data on what stakeholders think about aspects of school life and especially what happens in the classroom, so this will be covered later.
Case Study 2: Ms Mehta gathers evidence to check her intuition
Ms Mehta is the school leader of an increasingly successful rural middle and upper secondary school. As she was checking attendance data to send off to the district, she noticed a pattern emerging of the seasonal non-attendance of her female students in the middle school. It interested her enough to investigate further. What she discovered was that their attendance dipped dramatically during the planting and harvesting seasons. Her instinct was that this was linked to their mothers being needed in the fields and the elder daughters acting as mother to their younger brothers and sisters.
This initial review told Ms Mehta that she needed more evidence before she could be certain about the cause of the absences. With the support of her management committee she sought to get more information. She did three things:
- She carried out an informal survey of her female students in Class VI–VIII of those students with seasonal absence and those who consistently attended.
- She asked teachers who lived in the locality to make some home visits to interview the mothers.
- She created a new set of statistics, matching a sample of attendance of female students with exam results in Class X. She was interested to know what the pattern looked like. Unfortunately, she did not have a soft copy of the attendance-only paper records, so she got the support of one of her young, motivated teachers and her administrative assistant to collate and analyse (or crunch!) the numbers.
Ms Mehta found that there was a direct link (or correlation) between female students’ absences in the middle school with (a) drop-out at Class VIII, and (b) lower performance at Class X board examinations. This led to a target for the coming year to identify a strategy through the SMC to either reduce seasonal absenteeism or to find ways of supporting those students who are unavoidably absent to continue their studies.
Case Study 2 shows how data can be the catalyst for further investigation of any aspect of your school’s performance. In this case the review started with quantitative information that showed an issue (Stage 1 in Figure 2). Analysis (Stage 2) revealed a problem; this led to additional information-gathering to provide a deeper understanding of the issue and helped the school leader to organise a plan. In other cases you might start with qualitative information and then gather more quantitative information to provide a complete picture. In Ms Mehta’s case, she made a link between the low attendance of female students and their performance in exams.
When gathering data, it is important to ask: ‘So what?’ What is the impact on students’ academic, social, emotional and physical progress? Gathering data is of little value unless it is analysed and plans are made to build on emerging strengths and address areas for improvement (Stages 2 and 3 in Figure 2).
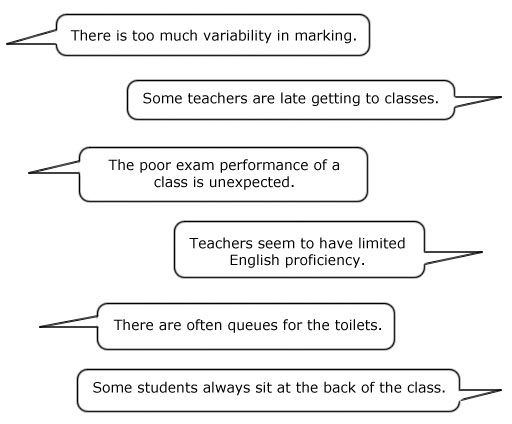
If you open up the discussion, your teachers and parents may suggest all sorts of sources of information for a school self-review that can span all aspects of school activity, such as:
The initial steps for the school to take once it has identified a potential issue – regardless of what it is – should include:
- deciding whether or not this is an issue that needs to be addressed
- identifying the team that needs to lead the evidence collection – in Case Study 2, Ms Mehta’s team included parents, members of the school board and local teachers
- identifying the evidence that needs to be collected
- evaluating the evidence to determine what the problem really is and how to address it.
Figure 4 Interpreting a report.

Gathering data is the starting point for your self-review. You then need to analyse the evidence (Stage 2 in Figure 2) and make judgements (Stage 3) about the strengths and areas for improvement. A common criticism of school self-review is that it can be too descriptive and insufficiently evaluative – school leaders merely describe what is happening without asking what they can learn from it.
In the case study, Ms Mehta didn’t just accept the data – she formed a hypothesis that she checked by collecting more data. In research terms, she ‘triangulated’ her data. Once she was sure that she really understood the reasons for the fall in attendance and had demonstrated the link between this and exam performance, she was able to take action.
Case Study 3: What is behind lateness?
School leader Mrs Agarwal overheard a conversation in the staffroom between the Class VI and Class VII teachers. Both were feeling frustrated because they felt that punctuality in their classes was getting worse. Mrs Agarwal asked them how they knew and they said it was just a feeling.
‘Is it the same students every day?’ she asked. They weren’t sure.
Mrs Agarwal promised to help them tackle the problem. She asked them to keep detailed records for two weeks of who was late and who was on time. She suggested that the teachers asked the students to keep their own records, as this might help them to take responsibility for making sure that they arrive on time.
After three weeks, the three of them sat down in order to analyse the data. They noticed that the students who lived in a certain part of town were late on Mondays and Fridays, and those who lived in a particular village were late on Wednesdays.
Activity 5: How the data leads to next steps
If you were Mrs Agarwal, what would you do next? You have data on attendance and have analysed it to see that there are patterns of attendance relating to where the students live. What are the possible reasons for this? In your Learning Diary, make a list of the questions you would ask and the data you would collect in order to understand what is happening and why.
Discussion
Remember that you would be doing this activity with these two teachers so that you can share the responsibility for asking questions and collecting data. You will probably have noted that you need to talk to students and their parents to get more data and maybe find out what transport they use to get to school. There may be factors such as market days or religious observance that affect attendance, so you need to allow yourself to be surprised about what data you uncover and not narrow your questions to only check out your own hypothesis. If Mrs Agarwal suspects that the poor attendance is solely due to family responsibilities, she may not enquire enough about road conditions or the logistics of getting to school on those days.
Collecting data and information can be used to solve specific problems, but more importantly, it can provide you with an overview of how your school is doing. This is Stage 4 in the evaluation cycle shown in Figure 1.
As you develop the habit of collecting data, you will be able to look at trends over time as well as achievement or attendance in a particular year. By breaking down the data, you can reveal what it is actually telling you. This might be, for example, that female students’ attendance in Class I–IV is almost 20 per cent higher than in Class V–VIII, or that attendance drops by almost 35 per cent at harvest time.
1 What a school self-review is, and its advantages and challenges